Understanding how to Inspect Elements in Chrome is a critical skill for web developers and designers alike. This tool is indispensable, no matter what web development task you’re tackling.
From resolving layout issues and debugging JavaScript to analyzing a webpage’s structure, Chrome’s Developer Tools’ “Elements” panel offers a robust suite of functionalities that enable you to delve into the HTML, CSS, and JavaScript that power websites.
In this comprehensive guide, we’ll explore the ins and outs of using the Inspect Element feature in Chrome. You’ll gain in-depth insights into leveraging this tool to identify and fix bugs, enhance performance, and ultimately elevate the functionality of your web applications.
Whether you’re a seasoned developer or just starting, mastering the Inspect Element tool is a step forward in optimizing your web development process.
How to Inspect Element In Chrome?
Inspecting elements in Chrome are crucial for web developer and designer due to several reasons as under:
- Understanding the structure and layout of a webpage
- Modifying the structure of a webpage
- Analyzing and modifying CSS styles
- Experimenting with different styles
- Troubleshooting layout issues
- Debugging JavaScript code
- Logging messages in the Console panel
- Executing JavaScript code
- Analyzing the behavior of scripts in real-time.
Getting Started With Inspecting Elements In Chrome
The initial step for inspecting elements in Chrome is to to open the Chrome DevTools. Following are the different ways to perform this task:
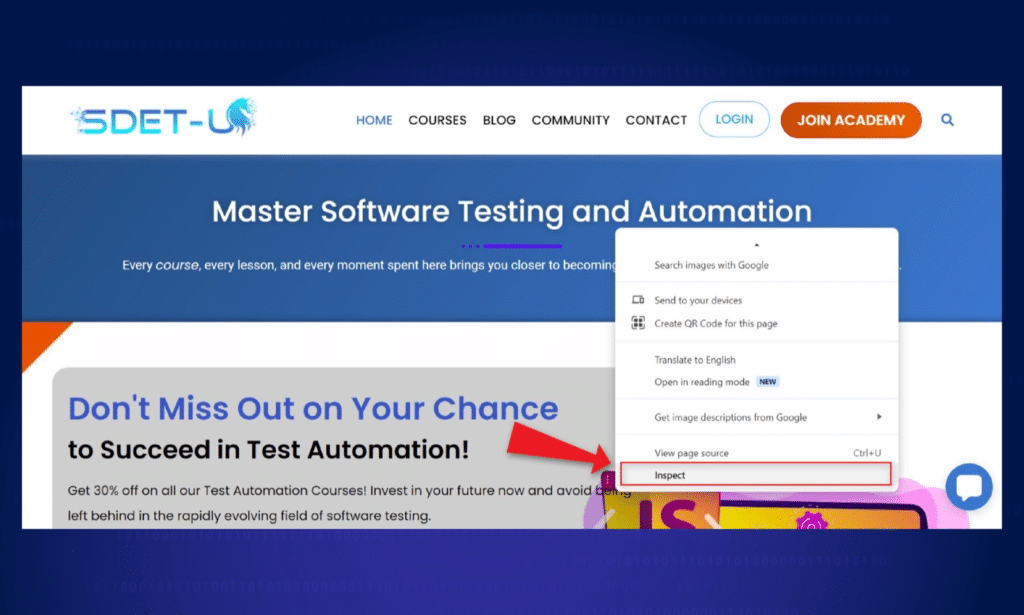
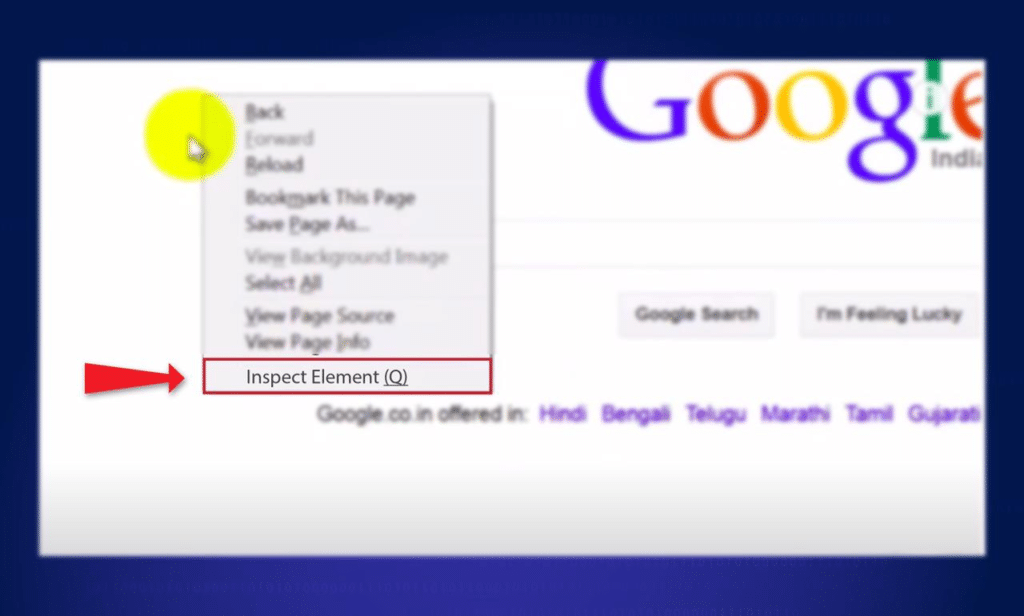
- Right-click on any element on a webpage and select “Inspect” from the context menu bar.
- Use the keyboard shortcut key to open inspect element tool
- MacOS: Command + Option + C
- Windows: Control + Shift + C.
- Go to the Chrome menu (the three vertical dots in the top-right corner), select “More Tools”, and then “Developer Tools”.
Once the Chrome DevTools are open, you’ll see a panel that appears at the side or bottom of your browser window. This is the main interface for inspecting elements in Chrome.
Understanding the Chrome DevTools Interface
The Chrome DevTools interface is divided into several inspect element panels, each inspect element panel has its particular purpose. The main panels you’ll be working with while inspecting elements are;
- The Elements panel
- The Styles panel
- The Console panel
The Elements Panel:
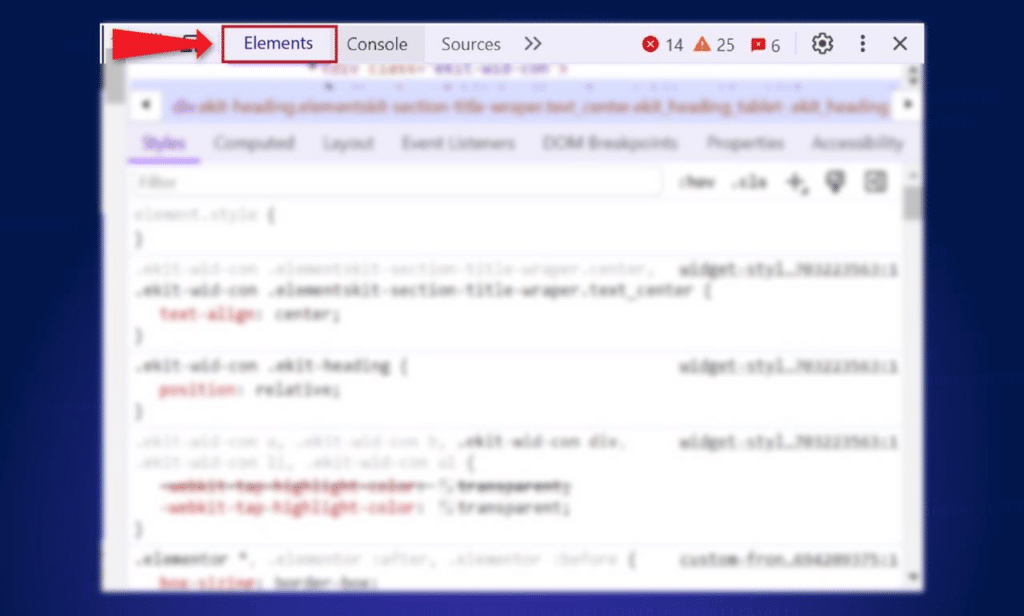
It displays the HTML structure of the webpage you’re inspecting. It provides a hierarchical view of all the elements on the page, helping you to easily navigate and inspect different parts of the DOM (Document Object Model).
The Styles Panel:
It shows you all the CSS styles applied to a selected element. In this panel you can view and modify the several preset screen resolutions, styles to experiment with different designs or solve different layout issues.
The Console Panel:
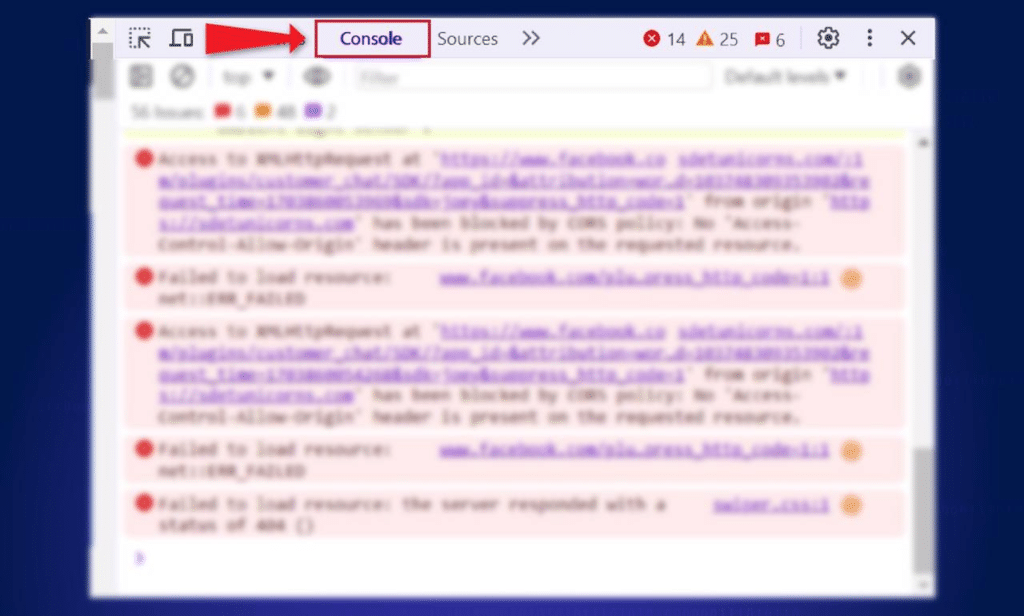
This is the one where you can execute JavaScript code, log messages, and debug your scripts. It is an effective tool for troubleshooting and analyzing the working of your web applications.
Exciting Features of Inspecting Elements Panel
The Elements panel is the heart of the Google Chrome Developer Tools. It has developer tools that allow you to explore and customize the Document Object Model (DOM) of a web page the way you like.
Here is a step-by-step guide on how to navigate the Elements panel of the desired web page:
- DOM Tree: The left side of the panel displays the DOM tree, it represents the sequence of HTML elements on the page.
- Styles and Computed Styles: The right side provides information about the selected element’s styles. Look for the Styles and Computed tabs to understand how CSS rules apply to the element.
- Event Listeners: Check the Event Listeners tab to identify and troubleshoot any JavaScript event listeners attached to the element.
Inspecting Elements in Mozilla Firefox
Similar to Google Chrome, Mozilla Firefox also enables web developers to use useful inspect features of developer tools for inspecting and debugging web elements. Whether you are an expert developer or just a beginner, understanding how to inspect elements in Mozilla Firefox is a fundamental skill.
To begin inspecting elements in Mozilla Firefox, you need to access the Firefox Developer Tools. Here’s is the simplified way of performing it:
- Right-Click Inspection: Right-click on any element on a webpage and select “Inspect Element” from the context menu. This opens the Inspector panel within the Firefox Developer Tools.
- Keyboard Shortcut: Use the keyboard shortcut Ctrl + Shift + I (Windows/Linux) or Cmd + Opt + I (Mac) to open the Developer Tools directly.
- Menu Navigation: Navigate to the Firefox menu (three horizontal lines in the top-right corner), select “Web Developer,” and then choose “Toggle Tools.”
Using The Elements Panel To Inspect Element Tool of Html And CSS
The html element panel is on the top due its amazing features and capabilities among all the inspecting elements in Chrome. It allows the users to explore and analyze the HTML source code of a webpage, as well as to inspect and modify the CSS properties, applied to inspect element tools.
To inspect an element, choose to inspect element and simply hover over (move your cursor) on the Elements panel or on the web page itself. As you hover over different elements, you will see them automatically highlighted in the web browsers window. This indicates their position and size on the page.
Clicking on an page element in the Elements panel will show its HTML code, its corresponding source code and any related CSS styles in the Styles panel.
You can modify these styles directly in the Styles panel to experiment with different designs or troubleshoot layout problems.
Inspecting And Editing CSS Styles Of A Web Page
The Styles panel in the Chrome DevTools allows you to inspect and edit the CSS styles applied on different elements on the Chrome browsers. This is especially very useful for web designers. Being creative, they can play around with different styles for layouts.
- Inspecting: When you select an element in the Elements panel, the Styles panel will display all the CSS styles that apply to that specific element. Make sure the responsive design mode icon is visible. You can view and change these styles in real-time and see the changes showing up immediately on the webpage through automatically highlight feature of the inspecting elements.
- Editing: For editing a CSS style, simply click on the property value you want to change and enter a new value. You can also add new styles by clicking on the “+” icon in the Styles panel and entering the desired property-value pair.
Analyzing Network Activity
In order to inspect elements in Chrome, it is important to make sure that the network activity and connection speed does not has any problem that might slow down the process or cause problems with loading resources.
In Chrome DevTools, the Network panel can give you information about requests and responses. You can filter the requests by using the filter bar, which helps you focus on specific types of requests like XHR, JS, or CSS.
This makes it easier to identify and fix errors by using your web application.
The waterfall chart in DevTools allows you to see the sequence in which resources load. Through this you can also identify any suspected defects like slow-processing or failure of requests.
Utilizing the Application Panel
The Application panel in Chrome DevTools has many more features other than just inspecting elements. It gives you information about the resources, service workers, and storage of your application.
By using this panel, you can learn about caching, control cookies, and make your web application work efficiently.
- Service Workers: By studying service workers, you can learn how they affect the performance of your web app. This will help you solve problems with features that work offline and the way your app stores data.
- Cookies and Storage: Use the Cookies and Storage sections to control and check the information stored by your web app on your computer. This is helpful for finding and fixing problems with logging in and making sure that data stays even after closing the app.
Inspecting And Debugging In Javascript
The Chrome DevTools’ Console panel is a powerful tool for inspecting and debugging JavaScript files. It allows you to execute JavaScript code, log messages, and analyze the behavior of your scripts in real-time.
- Execute JavaScript Code: To open the Console panel, click on the “Console” tab in the Chrome DevTools interface. Here, you can type JavaScript code directly into the console and press Enter to execute it. You will notice the output of your code in the console, and you can also log messages using the console.log() function.
- Debugging: The Console panel is particularly useful for troubleshooting JavaScript errors. If you discover an error in your code, the console will display an error message with the line number and a description of the broken code. This can also help you to identify the source of the error and fix it efficiently.
Using The Console Panel For Troubleshooting
In addition to executing JavaScript code and logging messages, the Console panel in the Chrome DevTools offers several other features that can help you troubleshoot and analyze your web applications.
One of the most effective and useful inspect feature is its ability to check and change the values of variables and objects.
To do this, simply type the name of the variable or object into the console and press Enter. The console will display the current value of the variable or object.
Another helpful feature is the ability to analyze network requests.
The Console panel displays a list of all the network requests made by the webpage, including AJAX requests, image loads, and CSS file downloads.
You can click on a network request to view detailed information about it, such as the request and response headers, the request URL, and the response body.
Advanced Features And Tips For Inspecting Elements In Chrome
There are many advanced features and tips that can further enhance your productivity and efficiency. Here are a few:
- Use the “Elements” tab to find the DOM tree quickly. You can expand and contract elements by clicking on the arrow icons, making it easier to find specific elements.
- Use the search functionality in the Elements panel for searching specific elements by their tag name, class name, or ID, hence increasing your productivity.
- Use the “Copy” feature to copy elements, styles, or JavaScript expressions directly from the Chrome DevTools. This can save your time. It is used when you need to repeat or duplicate a specific element or style in your code.
- Use the “Toggle Element State” feature to simulate different states of an element, such as hover or focus. This is helpful for testing interactive elements or troubleshooting CSS styles that are only functional under certain conditions.
Keyboard Shortcuts for Efficient Element Inspection
Efficiency is the key to success in the field of web development. Explore the entire collection of shortcut keys provided within the Chrome DevTools. The shortcut keys are very useful quick navigation of processes and actions while you are inspecting the elements.
There are shortcuts for fast switching between panels, toggling the console, and navigating through the Elements panel. This improves your workflow and productivity.
Conclusion
Getting good at using the “Inspect Element” feature in Chrome can really make a difference for web developers and designers. With Chrome DevTools, including the Elements panel, Styles panel, and Console panel, you get a great set of tools to help you see and work with the structure, layout, and behavior of webpages.
Whether you’re fixing a layout problem, figuring out a bug in your JavaScript, or trying out new designs, Chrome DevTools are there to help you inspect, understand, and change elements in Chrome easily.
So, the next time you’re working on a web development task and run into a challenge, remember to use Chrome’s inspect feature. It can help you solve problems faster and make your websites better. Happy inspecting!
Frequently Asked Questions
Inspecting elements helps in understanding webpage structure, customizing layouts, analyzing and modifying CSS styles, troubleshooting layout issues, and debugging JavaScript code.
Right-click and select “Inspect,” use Ctrl + Shift + I (Windows/Linux) or Cmd + Option + I (Mac), or go to Chrome menu > More Tools > Developer Tools.
The main panels are the Elements panel (for HTML structure), Styles panel (for CSS styles), and Console panel (for JavaScript).
Select an element in the Elements panel, and view and change CSS styles in the Styles panel in real-time. Click on the property value to edit.
It helps identify problems affecting webpage loading or slowing down the application. The Network panel provides details about requests and responses.
Open the Console panel, type JavaScript code directly, and press Enter to execute. It’s useful for debugging errors and logging messages.